WELLOG CROSS-PLOTS
Revised
© 2007-2008 WELLOG
All Rights Reserved
CROSS PLOTS:
Cross plots are used in well log analysis to calculate from graphs or charts a result based on two or more forms of data.
SHALY SAND CROSS PLOT (
An example of a common cross plot is one designed to determine total porosity and shale content of a shaly sand when the shale and sandstone separately meet the conditions specified on the chart.
Given information from Acoustic velocity and Bulk density logs;
Given Dt = 90 usec/ft., and rb = 2.40 grams/cc
1. Enter the chart with the given data to the point of intersection.
2. Read porosity = 16.8 percent, shale content = 29 percent
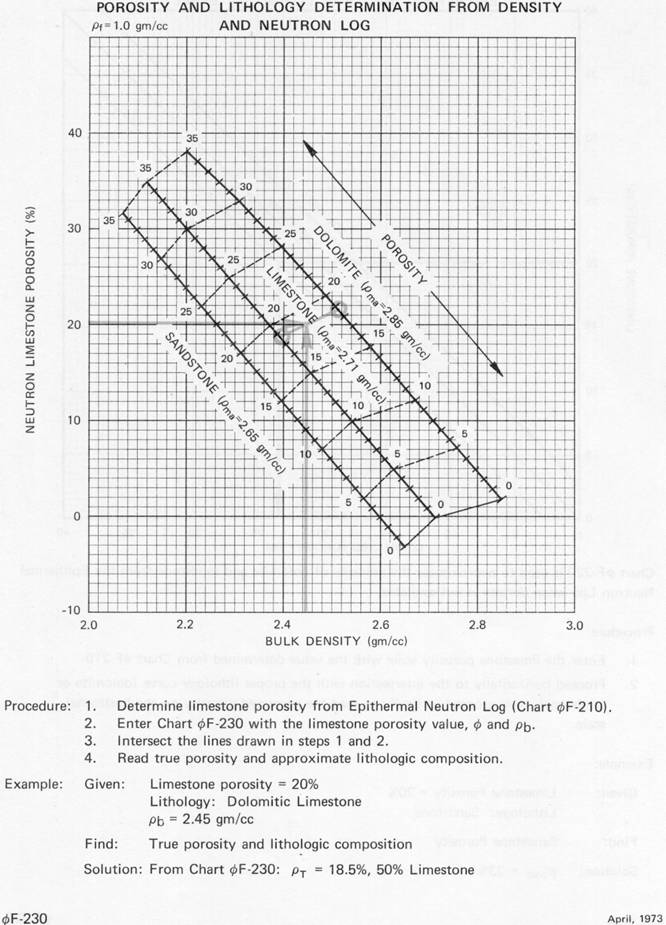
NEUTRON-DENSITY CROSS PLOT:
One of the earliest cross plots is the neutron-density cross plot.
This cross plot is used in log analysis for determination of porosity and
lithology from neutron porosity and bulk density.
The neutron logging tool is calibrated to provide accurate
porosity in a Limestone formation (matrix). Neutron porosity is only valid
after making appropriate corrections and when used in a specific limestone
matrix. The neutron-density cross plot is used to perform the final analysis.
Given a neutron porosity measurement of 20 percent and bulk
density of 2.45 grams per cc. in Dolomitic Limestone.
1. Enter the chart
with the given values.
2. At the intersection, move parallel to the “ribs” to read true porosity = 18.5 percent and the
intersection is at 50 percent of the distance between limestone and dolomite so
the matrix is 50 percent composition of both.
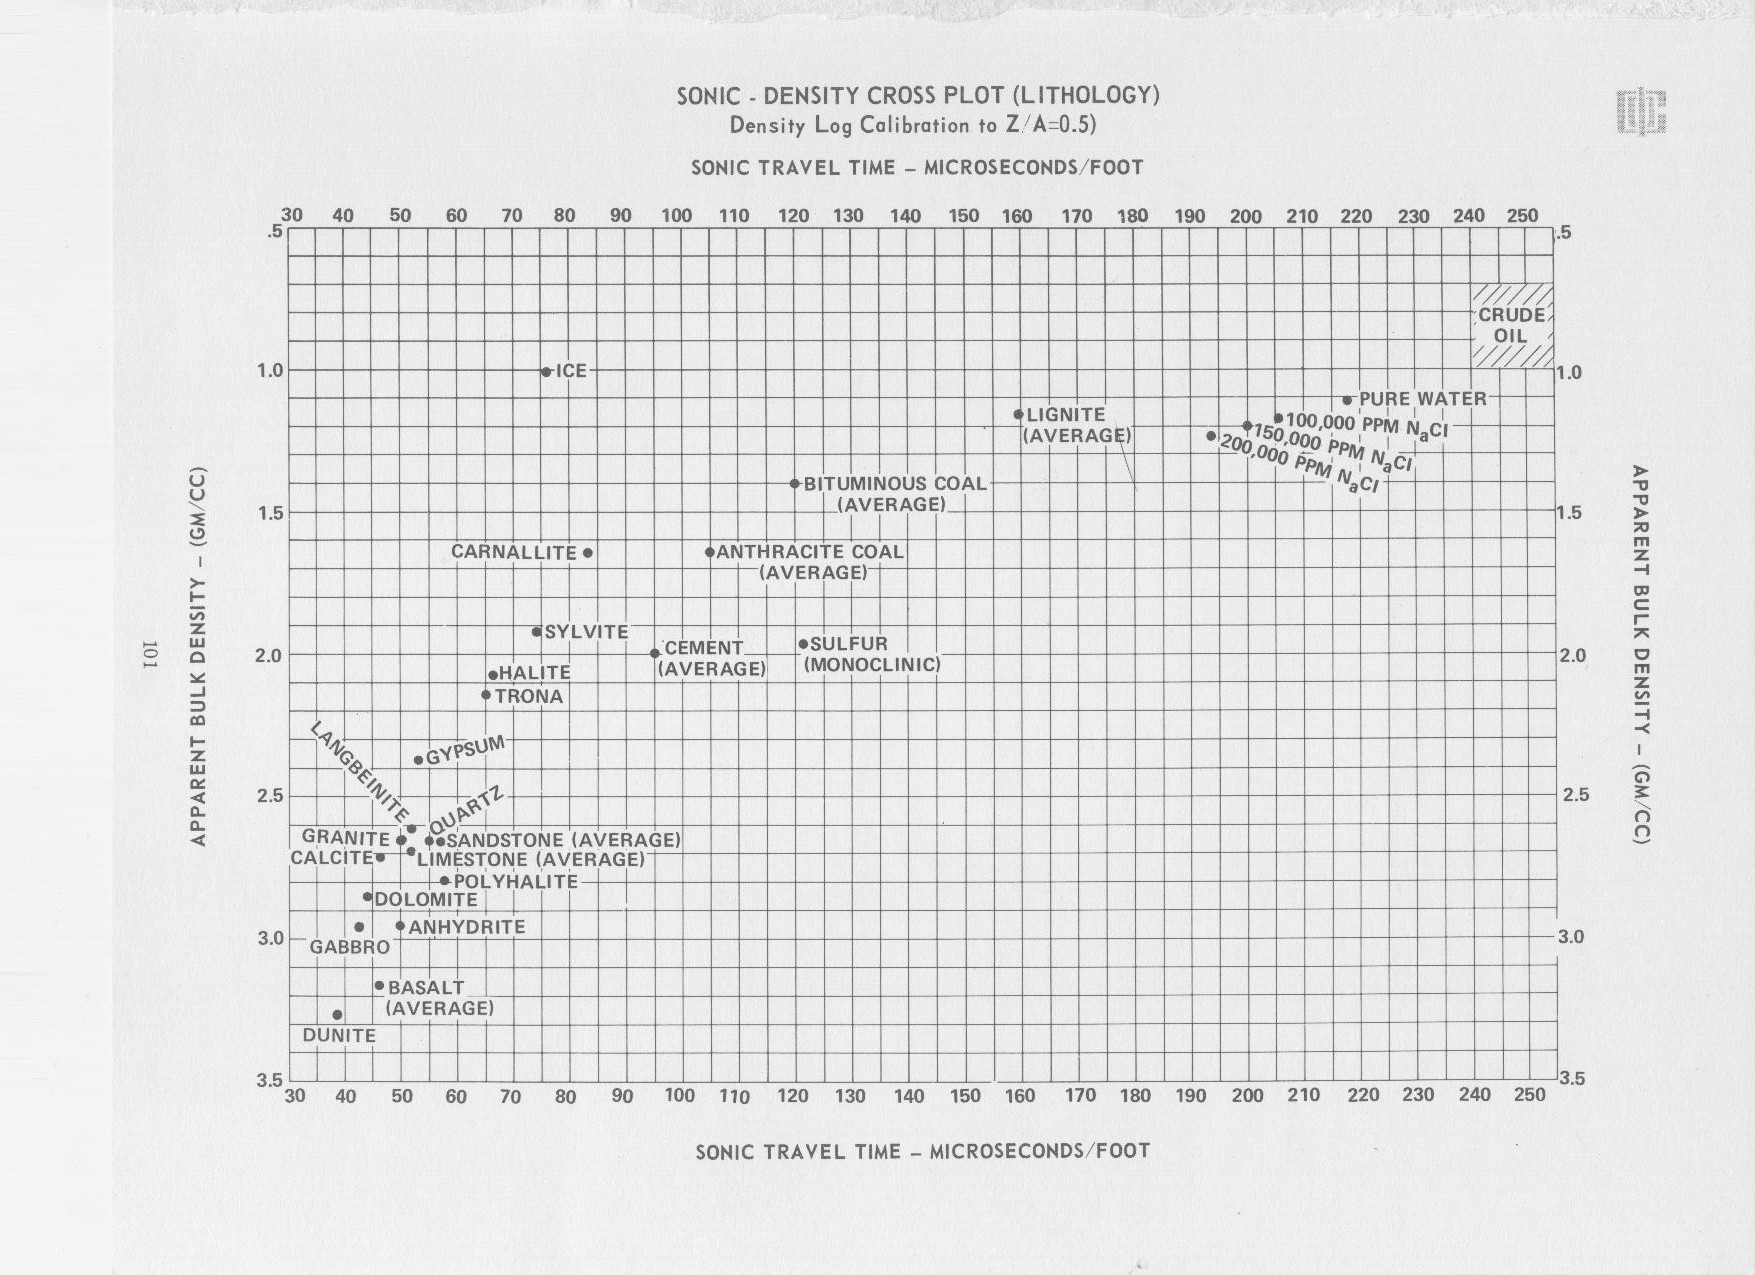
SONIC-DENSITY CROSS-PLOT:
A cross-plot of sonic travel time and formation Density can be
used to identify lithology. View a cross-plot chart.
Given a sonic travel time of 45 microseconds/ft. and bulk density
of 2.82 gm./cc.; probable lithology is a limey dolomite.
SONIC-NEUTRON CROSSPLOT:
Another option is combining sonic travel time and Neutron Porosity
to form a cross-plot. View a sonic-neutron cross-plot chart.
NEED MORE INFORMATION?
For additional information on cross-plots, contact WELLOG at info@wellog.com