WELLOG SHALE CONTENT
Revised
© WELLOG 2007
All Rights Reserved
Shale content may be estimated by a number of methods. Each when used “separately” commonly leads to errors. It is therefore recommended that the log analyst use combinations of methods. In practice, one determines shale content by studying the magnitude of gamma ray curve deflection supplemented by other information such as SP, Q-determination and cross-plotting.
GAMMA RAY METHOD:
Shale content by gamma ray, where the shale and shaly sand densities are similar, is equal to:
Shale % =
chart divisions between gamma ray curve opposite shale free formation and level of interest
divided by:
chart divisions between gamma ray curve opposite shale free formation and shale.
A correction to all curve values should be made for the effects of hole size and borehole fluids before using the above formula.
In estimating shale percentage by gamma ray one assumes that the size of gamma curve deflection is directly proportional to shale content, and that the shales adjacent to the formation in question are indicative of those within.
Gamma ray emission from most shales is essentially provided by contained uranium and thorium series elements and by the radioactive isotope of potassium, K40. Estimated (API study group RP-33, 1948) relative contributions to the effective gamma ray activity of average shales are: uranium series elements, 47 percent; thorium series elements, 34 percent; and potassium-40, 19 percent. Potassium-40 constitutes about 0.012 percent of natural potassium. It has a half life of 1.31 x 10⁹ years and emits a 1.5 mev gamma ray upon disintegration. The presence of any non-shale source of gamma rays, such as the potassium isotope fraction of orthoclase feldspar, must be determined and compensated for before accurate estimates of formation shaliness by gamma ray logging can be made.
Errors because of formation self absorption of gamma rays will occur where shale and sand densities are not alike. In such cases the above shale content calculation should be multiplied by the ratio of the half value thickness of the shaly formation to that of the shale (HVT shaly sand/ HVT shale). This would require a density log or an extensive backlog of reliable regional density information. Where half value thickness cannot easily be determined the ratio of densities will yield a usable approximate correction factor.
A x .8 multiplier is suggested for gamma ray calculated shale content to obtain actual percentage of shale.
SP METHOD:
Where formation water activity is uniform and formation resistivities are not high, the shale fraction may be estimated by:
1 – alpha, where: alpha = PSP/SSP
Alpha will vary from 0 in shale to 1 in clean sands. However, the magnitude of SP can be found to be 0 in impure “shales” that are actually 50 percent or more sand and silt materials.
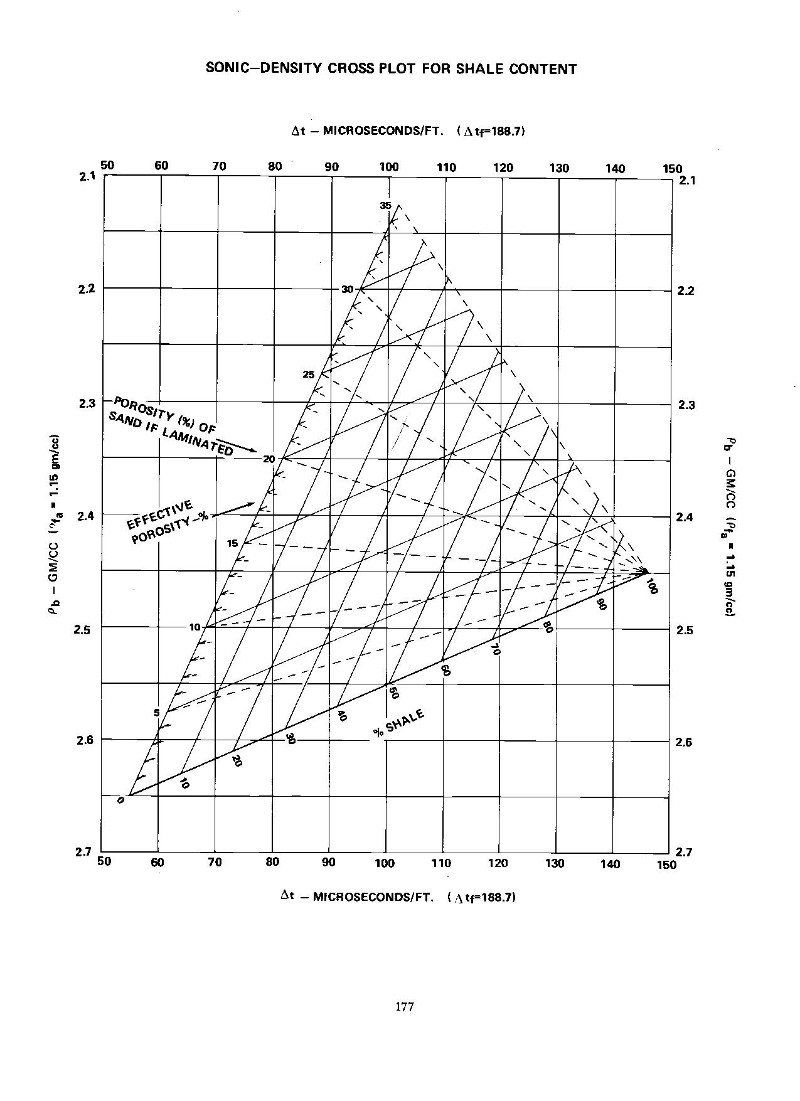
SONIC-DENSITY CROSS PLOTS:
These cross plots are for use where the shale content consists of shale laminations or where the shale in uniformly disseminated within the formation. They supply both the percentage of shale and effective formation porosity. Exact evaluation requires uniform non-shale matrix material, known saturating fluids, and identical shales within and adjacent to the formation in question.
Q-FACTOR METHOD:
Q (the fraction of intergranular space occupied by clay) is expressed by the following formula:
Q = FS-FD/FS (Chart)
The formula is for use with formations containing intergranular shale (clay). It assumes that the density of the included shale equals that of the non-shale matrix material. Although such a condition is seldom met, the formula can be used to estimate the shaliness at one level as compared with that of another level. Because low permeability is generally associated with shaliness, there will be a maximum Q value above which no production will occur. Experience has shown that this value is about 0.4.
POUPON, LOY, TIXIER METHOD:
P = (((Rt/Rxo) (S2/Sxo) (Rmf/Rw) )– 1 / ((S2/Sxo) (Rmf/Rw) – 1)) * (Rsh/Rt)
ALTERNATIVE METHOD:
Sonic – resistivity cross-plots may often be used for shaly sand interpretation without correction for shale content. This is because of the opposite compensating effects on the two devices caused by the shale. Shale increases apparent porosity while decreasing resistivity. In many instances, these errors compensate for each other and result in a calculated water saturation close to correct.
Reference: Gearhart–Owen Industries, Inc. Log Interpretation Reference Data Handbook, 1972
If you have questions about shale content contact info@wellog.com