Part 1,
Page 5
LITHOLOGY
IDENTIFICATION:
A logging tool that could measure lithology and produce a
“lithology Log” would be a valuable tool! When software is applied to multiple
logs in a well defined area, methods have been demonstrated that give
lithological representations.
One
tool that is considered by many to measure lithology is the Photoelectric
Density tool. The measurement of bulk density when plotted with a measurement
of atomic cross-section comes very close to providing rock type identification.
MINEROLOGY:
Lithology
is associated with certain mineralogy. Sandstone is composed largely of quartz
minerals. Limestone formations are composed of calcite and other related
calcium minerals. Dolomite is another common type of lithology.
Major
physical differences in these mineral types allow analysts to identify the
mineralogy.
Mineral: Density: Cross-section:
Dolomite 2.850 gm/cc 4.78 Sigma
matrix (x1021 Barns/cc)
Sandstone 2.655 gm/cc 8.66
Limestone 2.690 gm/cc 8.72
Anhydrite 2.950 gm/cc 12.30
Mineral
densities – Table 1
Mineral
densities – Table 2
SPONTANEOUS
POTENTIAL:
One of the first logging measurements ever recorded,
Spontaneous Potential, or SP provides information that infers lithology. In addition, SP can infer permeability. It is
possible to perform Lithology identification using multiple logs.
From
Schlumberger, C. & M., (1934), Doll, H. G., (1948), Wyllie, M. R. J.,
(1949) (1951) & others
Spontaneous
potential is a measurement of the natural voltage that is created from current
produced in the earth because of electrochemical action. It is normally
recorded in wells drilled with water.
Formations
having permeability are invaded by mud filtrate from
the drilling mud. The result is electrochemical action that causes current flow
in the formation. Shale formations have
very low or non-existent permeability and therefore no current flow and low
spontaneous potential.
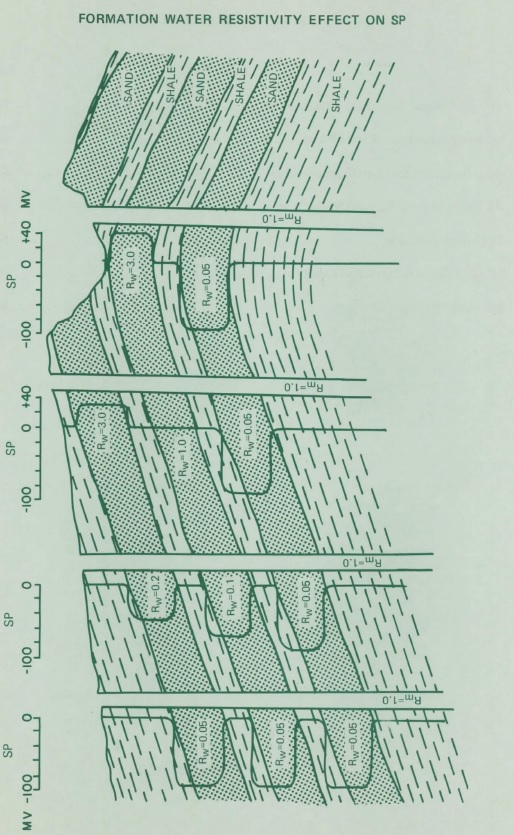
The SP
curve is recorded in track 1 (left-hand track) of the well log. The intensity
of the Spontaneous potential can be determined by charts using the
resistivity of the mud filtrate (Rmf) and the Formation water resistivity (Rw).
SP is
expressed as:
SP = -(60 +
.133T) log10 (Rmf/Rw)
Where:
T =
temperature
Rmf =
Resistivity of the mud filtrate
Rw =
resistivity of the formation water.
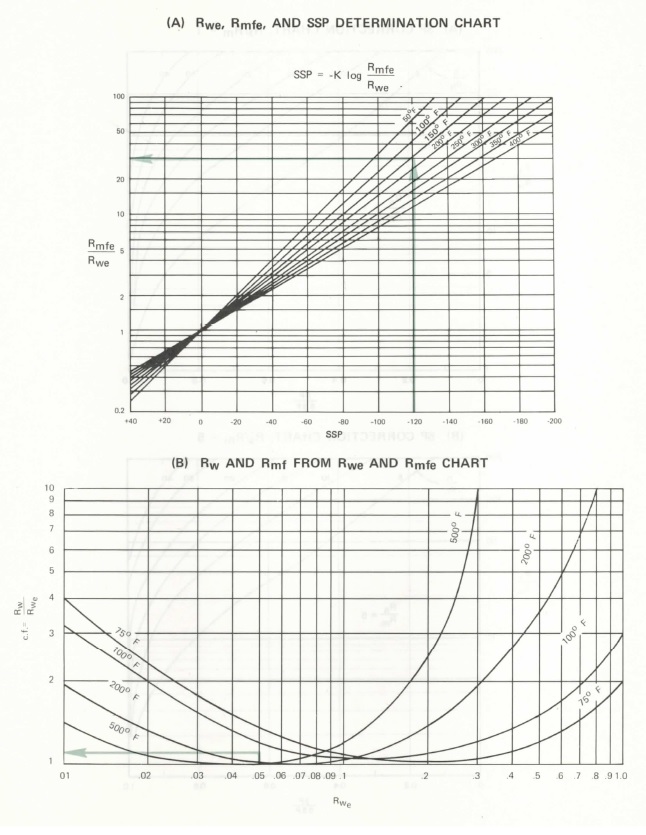
SSP = -(K)
log10 (Rmfe/Rwe)
Where:
T =
temperature
Rmfe =
Resistivity of the mud filtrate effective.
Rwe =
resistivity of the formation water effective.
Rmfe
and Rwe are obtained from charts
EXERCISE
1:
Generate
an MS excel spreadsheet with 4 columns.
Calculate SP in the 4th column.
Use the
following values:
Temp: Rmf:
Rw: SP:
110 100 .5 ?
110 100 .5 ?
View a
copy of an example spreadsheet (sp.xls).
Since
SP is not a zero based curve, its deflection is measured from a “shale base
line” or predominant right most deflection.
Shale
formations have little or no permeability.
Sandstone, limestone, and dolomite do have some degree of permeability.
The SP is useful in detecting permeable beds, locating bed boundaries,
determining water resistivity, and as a shale indicator.
In
formations containing hydrocarbons, SP is depressed because of the reduction of
conductive ions.
SP
curves may be calibrated using a fixed voltage calibrator.
CORRECTION CHARTS:
Charts
are used to predict SP from Rwe.
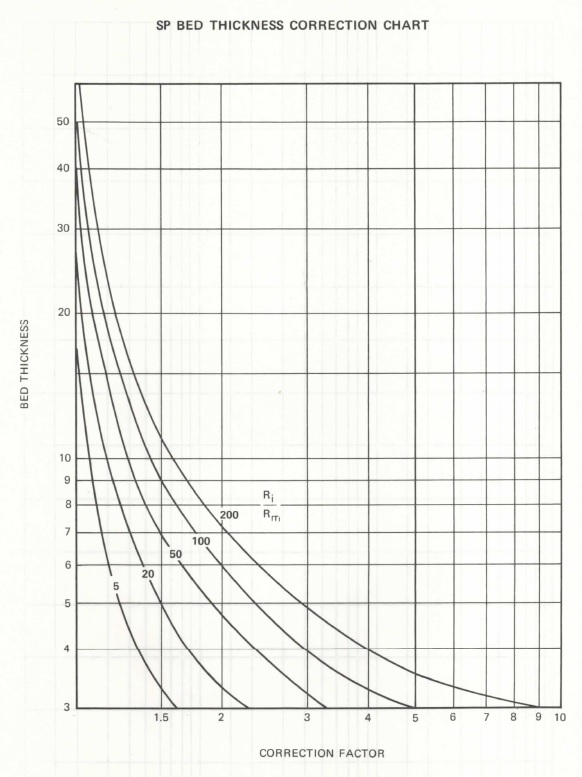
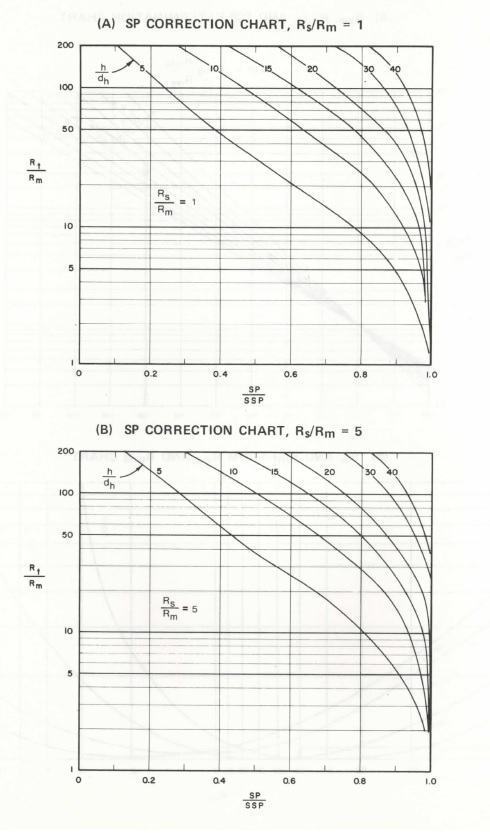
SP
measurements can be corrected for bed thickness and Rm and Rs.
GAMMA
RAY:
Clean
sandstones and carbonates are low in gamma radiation. In contrast formations containing shale are
higher in gamma radiation.
Gamma
radiation is statistical in nature because the radioactive decay of
radioisotopes is random.
Because
radioactive isotopes tend to concentrate in shale or clay formations and clean
sandstone and carbonate formations are low in radioactive isotopes, the Gamma
ray tool may be used to infer lithology.
Gamma
tools should be calibrated with a reference test source in order to perform in
a standardized manner.
Spontaneous
Potential and Natural gamma ray curves are positioned in track one of the log and indicate sandstone or carbonate formations when at
the extreme left of the scale and indicate shale or clay at the extreme right
side of the scale.
CORRECTION
FOR SHALE:
Certain
porosity logs require correction for “shale volume” (Vsh). Neutron porosity is
optimistic in shale. Acoustic porosity
is optimistic in shale. When shale is present, effective porosity, (phi
subscript e), can be used to more accurately determine water saturation (Sw) .
Using
information from the natural gamma log;
Shale Volume
= Vsh = (Gr – Grcs) / (Grsh – Grcs)
Where:
Gr =
Gamma ray counts in the zone of interest
Grcs =
Gamma ray counts in a clean sand
Grsh =
Gamma ray counts in a shale zone
Using
information from the SP log;
Shale Volume
= Vsh = (sp – spcs) / spsh – spcs)
Where:
SP = SP
in zone of interest
Spcs = sp in clean sand
Spsh =
sp in shale zone
Which
shale volume equation should be used?
Use SP
for shale volume calculation for instances of high Rmf/Rw.
Use
Gamma ray for shale volume calculation for instances of low Rmf/Rw.