WELLOG Resistivity Logging
Part
1, Page 6
RESISTIVITY CONCEPTS:
Resistivity can be defined as the degree to which a
substance resists the flow of electric current.
Resistance
from Ohms Law relates to current, and voltage as follows:
R
= V/I
Where: R = Resistance
V = Voltage
I = Current
The
simplest galvanic measurement is Resistance.
A Resistance log is performed by connecting one electrode to the surface
(ground) and another electrode to a downhole tool that is immersed in
borehole fluid. Applying a constant
current and measuring voltage allows calculation of resistance. This type of
log is called a single-point resistance log.
If both electrodes are placed on the tool, then a differential
resistance log is produced.
Multiple-electrode
arrays extend the depth of investigation. A better representation of True
Formation resistivity (Rt) is obtained. Formation Resistivity can be measured
when four electrodes are used. Two electrodes – one on the surface and one
down-hole on the tool are used to generate an electrical current in the
formations in and around the electrodes. The surface electrode is referred to
as B and the down-hole electrode as A. The voltage measured between two points
referred to and M and N is then calculated as follows:
VMN
= R x I/4p
x ((1/rAM-1/rAN)-(1/rBM-1/rBN))
View of resistivity
model.
The
Resistivity (R) (in a homogenous medium) is determined by:
R
= V / I x G
The apparent
Resistivity (ra) (in a heterogeneous medium) is
determined by:
ra = V / I x G
Where: G = Geometric array factor
V = Voltage
I = Current
Note
about symbology:
The
Greek symbol (r) and (R) are used in the well logging
industry and Geophysics for Resistivity.
The
meaning is the same in both cases.
Calculation
of Geometric Factor (G):
Normal
array:
G = 4 x p x (1/rAM – 1/rAN
– 1/rBM + 1/rBN) -1
Simplified: G = 4 x p x
MN
For example:
16” Normal; 16” = .4 meters; G = 12.56 x .4 = 5.02.
Where: MN = distance between MN electrodes in meters
for ohm-meters
Or…
MN = distance between MN
electrodes in feet for ohm-feet
Lateral
array:
G = 4 p x (1/rAM – 1/rAN)
-1
Resistivity
is a “physical property” and is independent of size and shape.
Resistivity,
(R) is expressed in units of ohm-meter2 / meter – abbreviated ohm-meters or ohms.
Conductivity
is the reciprocal of resistivity.
Conductivity = 1 / R
Conductivity
is frequently expressed in units of micro-mhos/cm.
Conductivity in
micro-mhos/cm = 10000/R
Where
Resistivity (R) is in units of ohms – meter2 / meter (also ohm-meters).
Also, conductivity is expressed in units of milli-mhos per
meter or simply milli-mhos. Another unit is milli-siemens.
Visit this web page for more information on the units of siemens and mhos.
Conduction
in liquids is controlled by ion flow.
Ions are created when sodium chloride (or
NaCl equivalent i.e., Potassium) are present in drilling and formation
waters. The higher the sodium chloride
concentration, the higher the conductivity and lower the resistivity. Ion flow is controlled by fluid viscosity and
therefore temperature affects the flow of ions and conductivity. Resistivity is affected by temperature. As temperature increases, conductivity
increases and resistivity decreases.
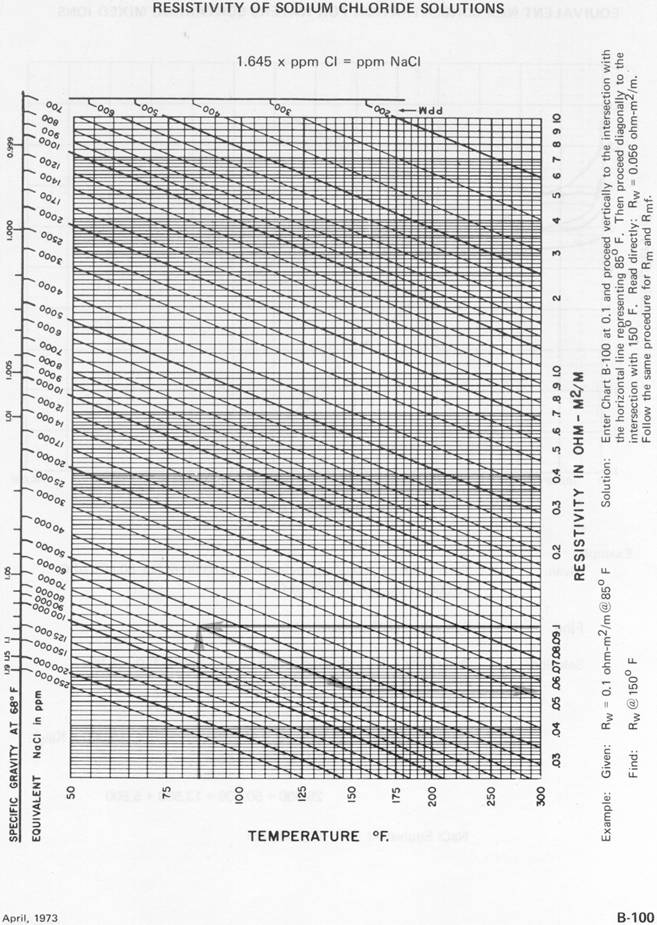
Determination
of Rw:
This
step is often overlooked! Here’s a couple of rules…
Before
any interpretation of resistivity data can take place, Rw must be known.
As
mentioned previously, the value of Rw is affected by temperature. If a water
sample is taken and Rw is measured, it is equally important to…
Note the temperature of the water
sample!
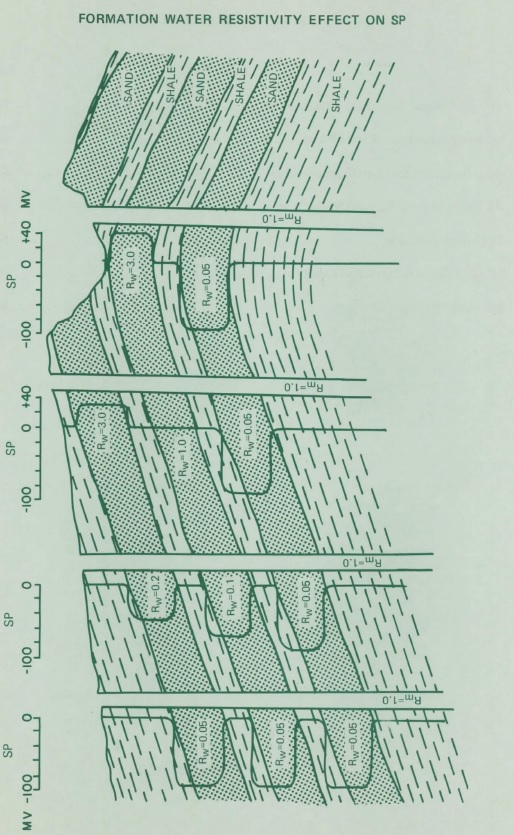
Determination of Rw from SP:
Resistivity
of formation water is related to the SP curve.
Rw may
be obtained from a chart.
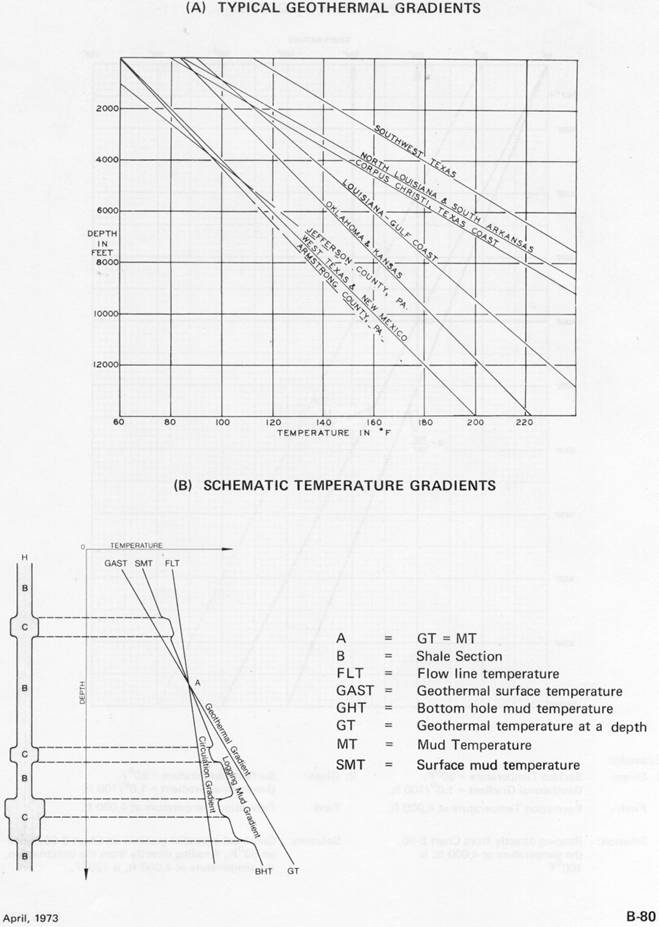
Geothermal
gradient:
Geothermal
gradient is a measure of temperature increase with depth. Geothermal gradients are normally 1.0 to 1.7
degrees per 100 feet. For example: If a
well has a surface temperature of 75 degrees F and bottom hole temperature is
175 degrees F at a depth of 10,000 feet, the geothermal gradient is 1.0 degrees
per 100 feet.
Evaluation
of a formation using Rw should always be performed using a corrected Rw at
formation temperature.
Rw @ temperature should be documented on the log heading.
A FREE
CALCULATOR:
When interpretation is performed on
resistivity IT MUST BE AT IN-SITU TEMPERATURE. For example, given Rw at 70
degrees F. What is Rw in the well at 200 degrees F? Here’s a Resistivity at T2 calculator.
Resistivity
related to porosity:
The
amount of water contained in a formation is directly related to porosity.
Porosity therefore affects formation resistivity. As the volume of water
increases, the capacity for ions increases. More ions mean more conductivity.
Conductivity and Resistivity are inversely related as previously mentioned.
Resistivity
of a formation 100 percent water saturated (Ro) = Formation resistivity factor
(F) times Resistivity of the water (Rw).
Formation
resistivity is affected by three factors: Salt Concentration, Temperature, Pore
volume (porosity).
Formation
Resistivity Factor is a proportionality constant based on the ratio of Ro to
Rw.
The
equation is: F = Ro/Rw Known as the Archie equation.
Ro is
resistivity of a 100 percent water filled formation and Rw is resistivity of
the water.
Given
Rw = .05,
If Ro =
5.0 then F = 100
If Ro =
1.25 then F = 25
If Ro =
.55 then F = 11
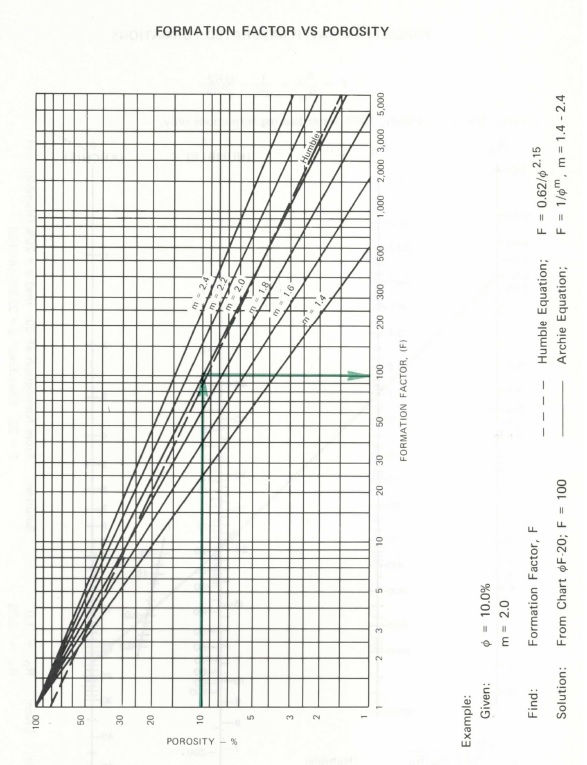
Formation resistivity Factor
(F) is related to Porosity (f) as
follows:
F
= a / fm
The
variables (a) and (m) are related to lithology. Cementation factor (m) in a
cemented sandstone or a porous limestone is 2.0 and (a) is equal to 1.0.
Resulting
in the equation:
Calculation
of Formation factor from porosity:
Porosity
of 10 percent results in a Formation resistivity Factor of 100
Porosity
of 20 percent results in a Formation resistivity Factor of 25
Porosity
of 30 percent results in a Formation resistivity Factor of 11
Notice
these three Formation Resistivity factors are the same as calculated with F =
Ro/Rw above.
RESISTIVITY
TOOLS:
Water
saturation and hydrocarbon saturation affect formation resistivity. The measurement of resistivity is therefore
one of the most important measurements to be made in logging a well. A
resistivity tool is most useful if it measures two or more characteristics of
formation resistivity. Resistivity measurements combined with porosity
measurements and estimations of permeability allow a complete analysis of a
well to be performed.
ELECTRIC
LOG (E-LOG):
The
Electric Logging tool was originally introduced by Conrad and Marcel
Schlumberger in 1927 in Pechelbronn France.
The
concept of operation of the electric logging tool is as follows:
When
two electrodes are placed in a oil or water filled
well and voltage is applied to them, a current will flow through the well fluid
and formation fluids. If additional
electrodes are placed in the vicinity of the current producing electrodes, a voltage
can be measured. The voltage measured is
directly related to the resistivity of the surrounding formation fluids. Electric logging tools generate an
alternating current and measure the resulting alternating voltage at
measurement electrodes. The depth of
measurement is directly related to the spacing or separation between
electrodes. The depth is approximately
equal to ½ of the distance from the measure electrode and the midpoint between
the two current electrodes.
Different
electrode configurations yield different depths of investigation.
The “normal” electrode configuration is as
follows:
One
current electrode (A) on the tool down-hole and the other current electrode (B)
located at the surface. Measurement electrodes (M) are spaced from the
down-hole current electrode at 8 inches, 16 inches, 32 inches or 64 inches
above the “A” electrode depending on tool design. The reference electrode (N)
is on the surface. The most common configuration is 16 inch (short normal) and
64 inch (long normal) spacing. This configuration results in a shallow
resistivity and deep resistivity measurement.
The “lateral” configuration
uses a current electrode (A) down-hole on the upper part of the tool or on an
electrode “bridle” and the other current electrode (B) on the surface. Two lower electrodes (M) (N) measure the
lateral voltage which is representative of a much deeper formation resistivity.
Lateral measurements can be from 72 inches to 18 feet or more depending on
electrode spacing and tool design. See AMN Lateral configuration.
Also, a configuration referred to as MAB electrode
configuration.
The
advantage of short spacing is better thin bed definition. The advantage of longer spacing is a deeper
measurement of true formation resistivity.
Comparison of deep and shallow resistivity gives information about
invasion. If shallow and deep
resistivity are the same, no invasion has occurred. If there is separation, the most probable
reason is that invasion has occurred causing the shallow (invaded) and deep
water resistivities to differ.
The
electric logging tool requires a fluid filled borehole in order to have a
complete electrical path.
CONSIDERATIONS:
All logging methods have limitations to
consider.
Bed thickness effect: The curves
produced by the normal devices are affected by bed thickness and resistivity
(Lynch 1962).
View a chart for bed thickness
correction for 16” normal.
View a chart for bed thickness
correction for 64” normal.
Formation transitions:
Where the resistive bed is more than
Although the radius of investigation
increases as the electrode spacing increases, the use of AM spacing greater
than 64 inches is not practical because thinner beds are not only shown at less
than true resistivity but may be recorded as conductive beds if their thickness
is less than or equal to the AM spacing.
Focused resistivity tools overcome this
limitation.
INVERSION METHODS:
Recently,
software has been developed for improving resistivity log interpretation. Old
logs and new are being subjected to inversion processing that removes the
effect of surrounding formations. These techniques will make electrical
resistivity a more accurate viable logging method well into the future.
INDUCTION
LOG:
Induction tools operate on the concept of
electromagnetic induction. A transmitter
coil is energized at a frequency of 20,000 cycles per second (20 KHz). The electromagnetic field is coupled through
the surrounding formations. Variation in formation fluid resistivity causes
amplitude and phase shifting of the transmitted signal. The formation produces
a secondary electromagnetic field. A
receiver coil having a fixed spacing receives the transmitter signal and the
phase shifted secondary signal related to conductivity is converted into
resistivity. Depth of investigation is
directly related to coil spacing. The induction resistivity tool does not
require conductive fluid in the borehole because it uses electromagnetism.
The
induction tool will not operate in steel casing.
DUAL
INDUCTION LOG:
Because
depth of investigation is related to coil spacing, the Dual Induction tool was
developed in order to get two depths of investigation. The Dual Induction tool has one or more
transmitter coils and two receiver coils at two fixed positions from the
transmitter. Focusing is performed through the addition of other coils.
Focusing of the electromagnetic field reduces the effect of borehole signal.
Invasion
profiles are obtained from charts available from
the logging service company.
GUARD
LOG:
In wells
containing highly conductive drilling fluids, guard tools are used. A focused guard tool offers
the function of having a focused current path into the formation. Electrodes surrounding the current electrode
are used to focus the tool current outward into the surrounding formation and
not allow the current to travel through the conductive borehole fluid.
Proper
interpretation of focused logging tool measurements involves use of correction
charts.
OTHER
RESISTIVITY TOOLS:
Many
specialized varieties of resistivity tools are available. Micro-resistivity [Wall] devices, for example, micro-log, mini-log,
FoRxo, Contact and others that measure resistivity of the borehole mud cake and
flushed zone. One such tool has a depth of investigation of 2 inches for
example.
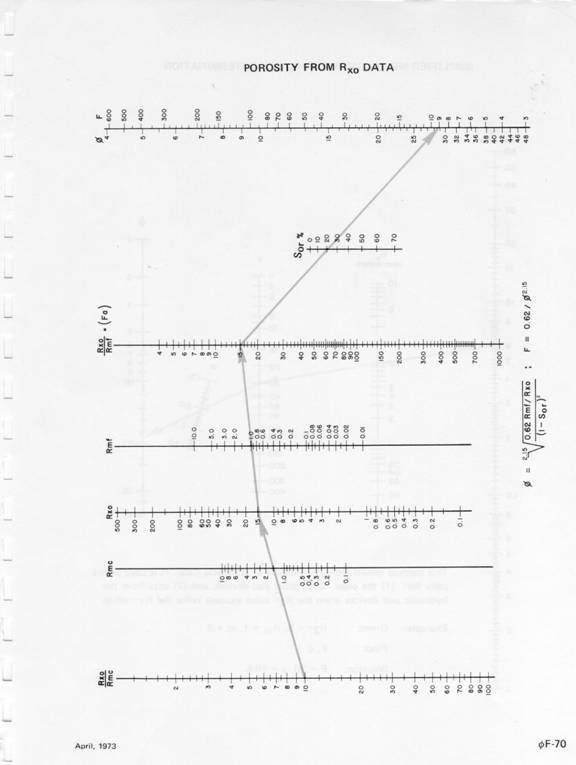
Micro-resistivity
provides a measurement of Rxo and Rmf. This information is valuable for the
purpose of determination of permeability. Permeability is established by
calculation of the saturation of the flushed zone (Sxo).
Sxo
= (Rmf/Rxo)1/2
Determine
porosity from micro resistivity using this chart.
Recently
added Electric and Induction tools can perform a synthetic aperture – measuring
at many different depths into the surrounding formation. Such tools give a more
precise profile of resistivities surrounding the borehole.
![[First Log]](http://www.wellog.com/elog1.jpg)